1
2
3
4
5
6
7
8
9
10
11
12
13
14
15
16
17
18
19
20
21
22
23
24
25
26
27
28
29
30
31
32
33
34
35
36
37
38
39
40
41
42
43
44
45
46
47
48
49
50
51
52
53
54
55
56
57
58
59
60
61
62
63
64
65
66
67
68
69
70
71
72
73
74
75
76
| window.initBlogStats = async function(config) {
if (typeof AV !== 'undefined' && !AV.applicationId) {
AV.init({
appId: config.appId,
appKey: config.appKey,
serverURL: config.serverURL
});
}
try {
const lineQuery = new AV.Query('DailyStat').ascending('date').limit(7);
const barQuery = new AV.Query('Counter').descending('time').limit(20);
const [lineResults, barResults] = await Promise.all([
lineQuery.find().catch(() => []),
barQuery.find()
]);
const lineDates = lineResults.map(i => (i.get('date') || "").substring(5));
const linePVs = lineResults.map(i => i.get('pv') || 0);
const lineUVs = lineResults.map(i => i.get('uv') || 0);
const barTitles = [], barViews = [];
barResults.forEach(item => {
let target = item.get('target') || "";
if (target.includes('/20')) {
let title = target.split('/').filter(Boolean).pop();
barTitles.push(title);
barViews.push(item.get('time') || 0);
}
});
renderLine(config.lineId, lineDates, linePVs, lineUVs);
renderBar(config.barId, barTitles.slice(0, 10).reverse(), barViews.slice(0, 10).reverse());
} catch (error) {
console.error("数据加载失败:", error);
}
};
function renderLine(id, dates, pvs, uvs) {
const dom = document.getElementById(id); if (!dom) return;
const chart = echarts.init(dom);
chart.setOption({
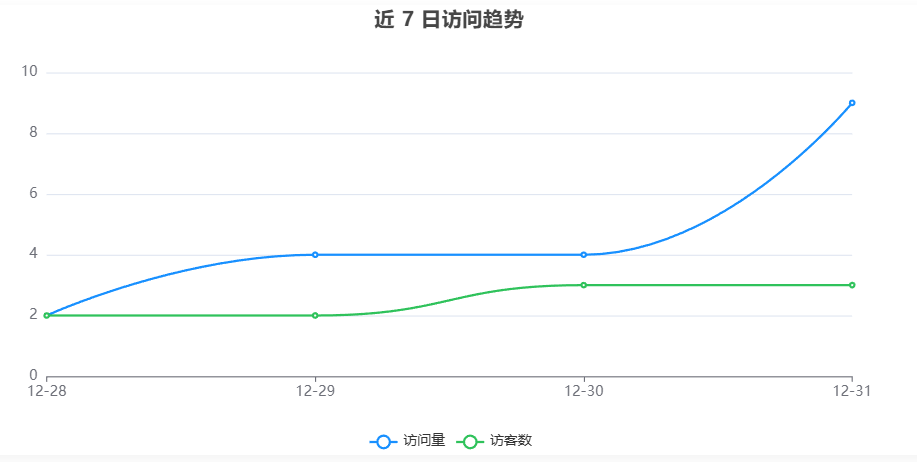
title: { text: '近 7 日访问趋势', left: 'center' },
tooltip: { trigger: 'axis' },
legend: { bottom: 0, data: ['访问量', '访客数'] },
xAxis: { type: 'category', boundaryGap: false, data: dates },
yAxis: { type: 'value' },
series: [
{ name: '访问量', type: 'line', smooth: true, data: pvs, itemStyle: { color: '#1890ff' } },
{ name: '访客数', type: 'line', smooth: true, data: uvs, itemStyle: { color: '#2fc25b' } }
]
});
}
function renderBar(id, titles, views) {
const dom = document.getElementById(id); if (!dom) return;
const chart = echarts.init(dom);
chart.setOption({
title: { text: '文章阅读量排行', left: 'center' },
tooltip: { trigger: 'axis' },
grid: { left: '3%', right: '12%', bottom: '5%', containLabel: true },
xAxis: { type: 'value' },
yAxis: { type: 'category', data: titles },
series: [{
name: '次数', type: 'bar', data: views, itemStyle: { color: '#1890ff', borderRadius: [0, 4, 4, 0] },
label: { show: true, position: 'right' }
}]
});
}
|